Tag Archives: memory

The Benefits of Having Too Much Processing Power

Do an experiment: keep Task Manager or any other CPU activity monitoring program up on your screen for a few hour or days, glancing at it every so often. Do you see it EVER above zero (other than momentary spikes)?

Here’s mine, from a Google sidebar gadget:

mycputime

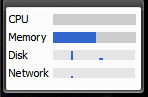
I’ve got a Dual Core and 2GB RAM. Currently I have open two copies of Visual Studio 2005, Word 2003, Outlook 2007, Paint.Net, RSS Bandit, Adobe Reader, IE, MSDN help, Windows Live Messenger, and Google Deskbar.

So that’s using just over 1 GB of RAM. And ZERO CPU. I’m watching this. The CPU meter goes up a little when I type, open a new program, compile my source code, etc., but most of the time it’s zero, even when I think I’m actually working.

I used to eschew running apps like Google Deskbar, wallpaper helpers like Display Fusion, or other system utilities that continually run. But I had a realization–it doesn’t matter! I could run many more utilities concurrently and still not come anywhere close to creating a slowdown on my computer.

Of course, I’m only talking about non-interfering/non-processor-intensive programs. This immediately excludes anti-virus programs, which interrupt every process to examine system behavior continually, or running video compression (duh) in the background.

But things like desktop searching, system monitoring (if it’s not too intrusive), utilities, and any other independent process–yeah, just throw them on. They won’t make a dent.

They key word in that last paragraph is independent. Independent means they don’t depend on or interfere with other processes.

Technorati Tags: ,,,,

How to measure memory use in .Net programs

In developing an important component (which I will discuss soon) for my current personal project, there were a number of different algorithms which I could use to attack the problem. I wasn’t sure which one would be better so I decided to implement each of them and measure their time/memory usage. I have a series of articles planned on those, but first I need to mention how I did the measurement.


For the timing, I simply wrapped the API functions for QueryPerformanceCounter and QueryPerformanceFrequency into a C# class. There are plenty of examples out there on the net to do this.

The memory usage is even simpler. The function you need is GC.GetTotalMemory(bool forceFullCollection). This function returns the amount of memory allocated. The little program below demonstrates how to use it.

using System;

namespace MemUsageTest
{
    class Program
    {
        static void Main(string[] args)
        {
            long memStart = GC.GetTotalMemory(true);
            Int32[] myInt = new Int32[4];
            long memEnd = GC.GetTotalMemory(true);

            long diff = memEnd - memStart;

            Console.WriteLine("{0:N0} bytes used", diff);
        }
    }
}

The output on my 32-bit system is “40 bytes used”–16 bytes for integers and 24 bytes of array overhead.

Passing true to GetTotalMemory is important–it gives the garbage collector an opportunity to reclaim all unused memory. There is a caveat, though. If you read the documentation, you’ll notice it says it attempts to discover the amount of bytes in use, and that setting forceFullCollection only gives it an opportunity and waiting a bit before returning. It does NOT guarantee that all unused memory is reclaimed.

As far as my work goes, I’ve noticed that it does a pretty reliable and consistent job.

Technorati Tags: , ,

A Debugging Exercise

A few weeks ago I had an interesting debugging problem. A program we develop had a memory leak in it that Visual Studio was catching when it ended. The trace text was something like this:

Detected memory leaks!
Dumping objects ->
{292300} normal block at 0x05590040, 2771928 bytes long.
Data: <> FF FF FF 00 FF FF FF 00 FF FF FF 00 FF FF FF 00
{292294} normal block at 0x05110040, 2613312 bytes long.
Data: <> FF FF FF 00 FF FF FF 00 FF FF FF 00 FF FF FF 00

Visual Studio 2003 is often pretty good at telling you where a memory leak occured, giving you a source code file and line number of where the memory allocation originated. In the case above, I don’t have that. There are two relatively easy ways of solving this.

The first method is to examine the data that isn’t being freed. In this case, I have two large objects of about 2.5 MB each. That’s pretty big–there aren’t too many (if any) individual objects in the software that are that large. So it could be an array. The data begins with a repeated pattern {FF FF FF 00}. Definitely looks like an array of 4-byte segments. Applying a little knowledge of the application itself–it displays large bitmaps–and we realize that the memory comes from an array of RGB values.

Another way to investigate this is to set a breakpoint on the memory allocation that isn’t being freed. The number in braces {292300} is the memory allocation number in debug mode in Visual C++. In order for this technique to work, you must first ensure that the number is the same each time. In my case, the memory leak would happen if I just opened and closed the program (because an image is always being drawn) without doing anything else.

First, set a breakpoint at the beginning of the program (or any place definitely before the memory leak). Start the program and when it breaks, enter the following into the watch window:

{,,msvcr71d.dll}_crtBreakAlloc

And for the value enter 292300.

If you continue the execution, the program will break on the 292,300th memory allocation. It will stop in the memory allocator, and you can then look at your stack frame and see exactly where the memory allocation is taking place.

MSDN has a great article about this.

In my problem it was for a set of memory blocks being used as working space for resizing and smoothing bitmaps. They were allocated once during execution and thus did not really provide a long-term threat. This leads to a possible third solution:

Ignore. All memory is reclaimed once the program exits. Nobody would ever do that, though…. would they?

…of course not…