Update: If you find this article useful, you can find a lot more information about garbage collection, debugging, PerfView, and .NET performance in my book Writing High-Performance .NET Code.
In my previous artlcle, I discussed 4 ways to optimize your server application for good garbage collection performance. An essential part of that process is being able to analyze your GC performance to know where to focus your efforts. One of the first tools I always turn to is a little utility that has been publically released by Microsoft.
PerfView Overview
PerfView is a stand-alone, no-install utility that can help you debug CPU and memory problems. It’s so light-weight and non-intrusive that it can be used to diagnose production applications with minimal impact.
I’ve never used it for CPU performance, so I can’t comment on that aspect of it, but that is the primary use for it (which is helpful to keep in mind when trying to grok the “quirky” UI).
PerfView collects data in two ways (as far as memory analysis is concerned):
- ETW tracing – This is the heart and soul of PerfView. It’s primarily an event analyzer with advanced grouping abilities to show you only the important things. If you want to know more about ETW, see this series at the ntdebugging blog.
- Heap dump – PerfView can dump the heap of your process and apply the same analysis and views that it does for events.
The basic view of the utility is a spreadsheet-like UI with function names and associated inclusive/exclusive costs – just like you would expect to see in a typical CPU profiler. The same paradigm is useful for memory analysis as well.
There are other views that summarize the collected events for you in easy-to-understand reports. We’ll take a quick look at all of this.
In this article, I’ll use PerfView to show you how to see the following:
- How frequently garbage collections occur and how long they take.
- The cause for Gen2 collections.
- The source of large-object allocations.
- The roots of all the memory in the heap to see who’s holding on to it.
- A diff of the heap to see what’s changing most frequently.
Test Program
When using a new utility like this, it’s often extremely helpful to create your own test programs with known behavior to ensure that you can use the utility to see what you expect. I’ve created a very simple one, here:
class Program
{
    private static List<int[]> arrays = new List<int[]>();
    private static Random rand = new Random();

    static void Main(string[] args)
    {
        Console.WriteLine("Press any key to exit...");
        while (!Console.KeyAvailable)
        {
            int size = rand.Next(1024, 100000);
            int[] newArray = new int[size];
            arrays.Add(newArray);
            System.Threading.Thread.Sleep(10);
        }
        Console.WriteLine("Done, exiting");
    }
}
This program “leaks” memory by continually creating arrays and storing them in a list that never gets cleared.
I also make it use server GC, to match what I discussed in the first article.
You can download the sample solution here.
Taking a Trace
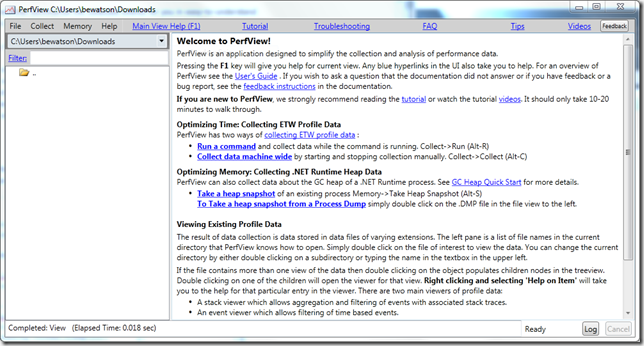
When you startup PerfView, you’ll see a window like this:
The manual is completely integrated into the program and can be accessed using the links in the menu bar. It’s a fairly dense information dump, but you can learn quite a bit about how to really get the most of out this utility.
First, start the test program and let it run in the background until we’re done taking the trace.
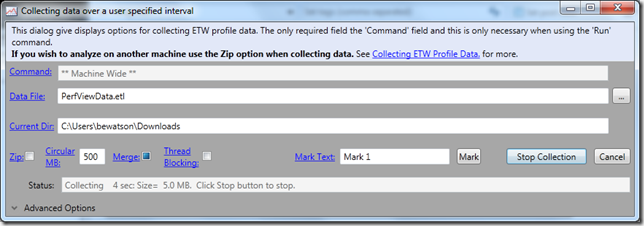
In PerfView, open the Collect menu and select the Collect command. A collection dialog will appear. Don’t change any setting for the moment and just hit Start Collection.You’ll see some status indicating the size and duration of the data collected. Let it go for at least 30 seconds. Note that you don’t specify which process you’re interested in at this stage – PerfView collects events for the machine as a whole.
When you’re done click Stop Collection. PerfView will process the collected events for a few seconds or minutes, and then a window will pop up asking you to select a process. Just cancel this (it wants to show you a CPU profile, which we’re not interested in right now) to get back to main screen.
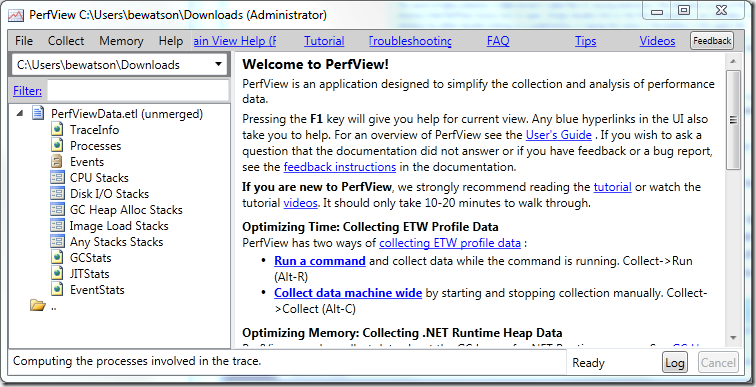
You’ll now see a file show up: PerfViewData.etl (unmerged). Click on the little arrow next to this and you’ll see:
From this, we’ll find all the data we’re interested in.
Get GC Stats (pause times and more)
The first place to start is just to get an overall picture of GC performance for your app. There is a view for just that. Double-click the GCStats report, and that will bring up a window with tables for each app. Find MemoryLeak.exe
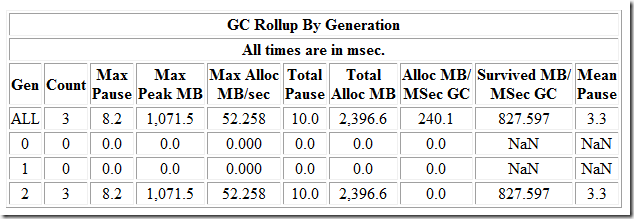
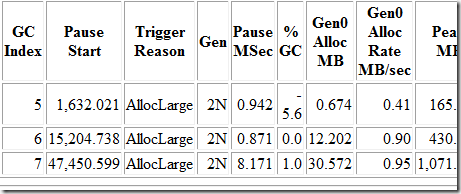
My test run yields this summary table:
Every garbage collection was a generation 2 collection (that’s generally a bad thing), but at least they were fast (to be expected in such a simple program).
Reason for Gen 2 Collection
Gen 2 GCs can happen for two reasons—surviving a gen 1 collection, or allocating on the large object heap. This view will also tell us, further down, which of these is the reason:
The collections happened because of large object allocation. You can also see that the second GC happened about 14 seconds after the first, and the next about 32 seconds after that. There are tons of other stats in this view, so look around and see what you can divine about the program’s behavior from this.
Get Source of Large Allocations
From the main PerfView screen, open the GC Heap Alloc Stacks view and find the correct process. This shows you a list of objects which represent the tops of allocation stacks.
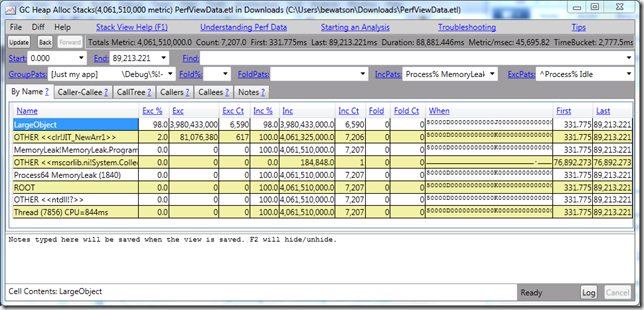
PerfView has helpfully organized all large-object allocations under the LargeObject entry. Double click this to see all such all allocations:
Important: If you see entries like this:
OTHER <<clr?>>
Then right-click on the list and click on Lookup Symbols. Follow the instructions to get the symbol server setup so you can see CLR and Windows function names.
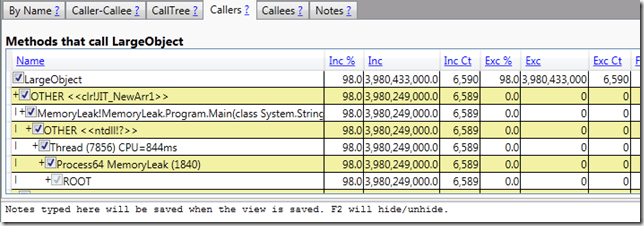
From the above entry view, it’s apparent that the vast majority of large objects are arrays being allocated in Main()—exactly what we expect given our predictable leaky program.
A note on the strange column names: remember how I said this program is designed for CPU profiling? These are typical columns for showing% of CPU time in various parts of a stack, repurposed for memory analysis. Inc % is the percent of bytes allocated on this object compared to all recorded allocations, Inc is the number of bytes allocated, and Inc Ct is the number of objects allocated.
In the above example, this reads: Allocated 6589 arrays for a total of 3.9 GB, accounting for 98% of the memory allocated in the process.
By the way, these are not 100% accurate numbers. There is some sampling going on because of how the events work, but it should be fairly close in most applications.
Who’s Referencing Leaking Memory?
One of the few ways to “leak” memory in C# is to hold onto it unknowingly. By taking a heap dump, we can see the path of object references for who’s holding onto memory.
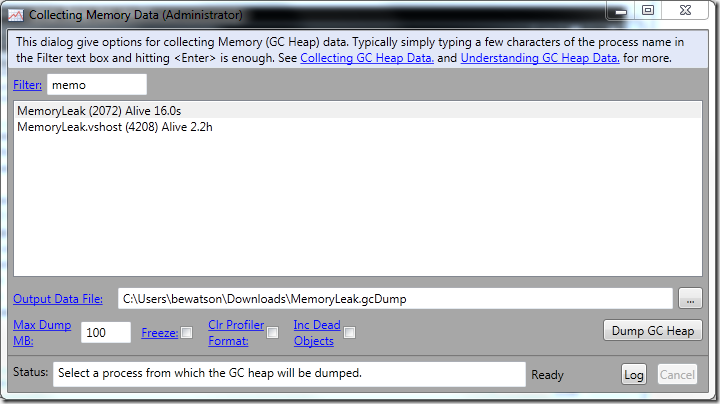
We’ll need to do a different type of collection. In the main PerfView window. Go to the Memory menu and click Take Heap Snapshot.
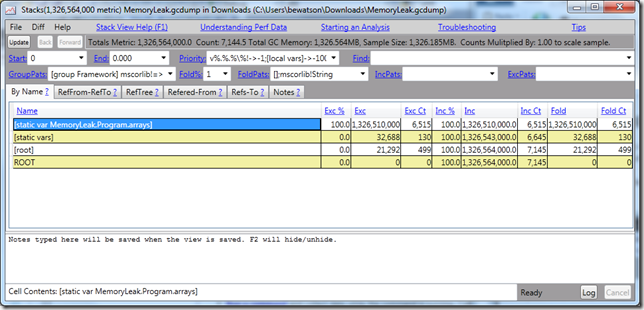
Find your process and click Dump GC Heap. This performs a live heap walk (that is, the application continues running, so it’s possible the view is slightly inconsistent—not usually an issue), sampling what it finds, and presenting the results in the same type of view as before:
Right away you can see that the static variable MemoryLeak.Program.arrays is holding onto 100% of memory in our application. The stack to the root isn’t that interesting in this case because all static variables are rooted directly, but if this were a member field, you would see the hierarchy of objects that are holding onto these references.
Use Two Heap Dumps to see What’s Increasing Fastest
While the test program is still running, take another heap dump, ensuring you save it to a different file. Open both dump views and in the second one, go to the Diff menu and there will be an option to use the other file as a baseline for the diff. This will bring up another window showing you the changes between the two dump files—extremely helpful for narrowing down the most likely areas for leaks.
Important: If you want to analyze the perf trace on a different computer than the one you took it on, you must tell PerfView to merge the file—this will cause all the different files it generated to be combined and symbols reconciled. Just right-click on the ETL file and select Merge. You can also optionally Zip the file (which implies a Merge).
Next Time
Next time, we’ll look at some more drastic measures for protecting yourself against expensive GCs—for when all else fails.
Pingback: 4 Essential Tips for High-Performance Garbage Collection on Servers | Philosophical Geek
Pingback: The Morning Brew - Chris Alcock » The Morning Brew #1150
Pingback: Cheatsheet: 2012 07.19 ~ 07.31 - gOODiDEA.NET
Hey Ben, I had looked at your posts for interviews. Would you recommend reading introduction to algorithms a good way to prepare for technical interviews?
Yes, you should definitely prepare by knowing as many algorithms as possible. More important than knowing all the possible algorithms, though, is really understanding them, and the fundamental principles underlying many of them.
PerfView throws an exception immediately when I try to collect. I’m running on Win 7 64-bit, running PerfView with Administrator privileges. Anyone have any suggestions?
Exception Occured: System.Runtime.InteropServices.COMException (0x80070521): A specified privilege does not exist. (Exception from HRESULT: 0x80070521)
at System.Runtime.InteropServices.Marshal.ThrowExceptionForHRInternal(Int32 errorCode, IntPtr errorInfo)
at Diagnostics.Tracing.Parsers.TraceEventSession.EnableKernelProvider(Keywords flags, Keywords stackCapture)
Hi Andrew, I’m sorry you’re getting this problem. Unfortunately, I’m not sure why. You’re sure you’re running with admin privileges? Does your account have debugging privileges as well?
Images aren’t visible and clicking on them produces a 404.
Fixed. Thanks.
Pingback: Using MemoryStream to Wrap Existing Buffers: Gotchas and Tips | Philosophical Geek
Can I use PerfView for ASP.NET 4.5.1 applications in Production Environment?
I have a issue OutOfMemory http://stackoverflow.com/questions/33436607/outofmemoryexception-using-rdlc-localreport-microsoft-reporting-webforms-in-as
I would like use tools like PerfView for collect more information.
Thanks a lot. Great blog!.
Absolutely! There are some built-in views targeting ASP.Net directly. Read the included manual to learn more.
Pingback: Analysing Pause times in the .NET GC (by matt warren) – ugurak.net
Pingback: Collecting Trash Revisited – Garbage Collection Essentials in .NET | A posteriori