Tag Archives: .net

Appearance on .NET Rocks! Podcast

Carl and Richard put together a great podcast. .NET Rocks! has existed for years now and it’s amazing how many episodes they’ve published.

A couple of weeks ago, I had the privilege of recording their latest episode with them, #1041. We talked about a ton of interesting things like the importance of memory management, precise measurement, using the correct tools, not being afraid of the debugger, a little bit about Microsoft culture, and even LEGO!

Here is their description:

Carl and Richard talk to Ben Watson about his work around writing high performance .NET code. Ben talks about how the Bing team decided to use .NET code internally, which seems like an obvious choice for a Microsoft group, but it isn’t really – when milliseconds count, does .NET makes sense? Ben says it does, and he’s done the work to prove it. Ben’s book “Writing High Performance .NET Code” focuses not only on coding techniques, but also the larger practice of having a deep understanding of how .NET works, and the processes that take place to turn .NET code into machine code. The conversation also digs deeply into the need for performance measurement, especially Event Tracing for Windows. .NET can be fast when you do it right!

Give a listen. Subscribe in iTunes or listen on the web. Let me know what you think!

Digging Into .NET Object Allocation Fundamentals

[Note: this article also appeared on CodeProject]

Introduction

While understanding garbage collection fundamentals is vital to working with .NET, it is also important to understand how object allocation works. It shows you just how simple and performant it is, especially compared to the potentially blocking nature of native heap allocations. In a large, native, multi-threaded application, heap allocations can be major performance bottleneck which requires you to perform all sorts of custom heap management techniques. It’s also harder to measure when this is happening because many of those details are hidden behind the OS’s allocation APIs. More importantly, understanding this will give you clues to how you can mess up and make object allocation far less efficient.

In this article, I want to go through an example taken from Chapter 2 of Writing High-Performance .NET Code and then take it further with some additional examples that weren’t covered in the book.

Viewing Object Allocation in a Debugger

Let’s start with a simple object definition: completely empty.

class MyObject 
{
}

static void Main(string[] args)
{
    var x = new MyObject();
}

In order to examine what happens during allocation, we need to use a “real” debugger, like Windbg. Don’t be afraid of this. If you need a quick primer on how to get started, look at the free sample chapter on this page, which will get you up and running in no time. It’s not nearly as bad you think.

Build the above program in Release mode for x86 (you can do x64 if you’d like, but the samples below are x86).

In Windbg, follow these steps to start and debug the program:

  1. Ctrl+E to execute a program. Navigate to and open the built executable file.
  2. Run command: sxe ld clrjit (this tells the debugger to break on loading any assembly with clrjit in the name, which you need loaded before the next steps)
  3. Run command: g (continues execution)
  4. When it breaks, run command: .loadby sos clr (loads .NET debugging tools)
  5. Run command: !bpmd ObjectAllocationFundamentals Program.Main (Sets a breakpoint at the beginning of a method. The first argument is the name of the assembly. The second is the name of the method, including the class it is in.)
  6. Run command: g

Execution will break at the beginning of the Main method, right before new() is called. Open the Disassembly window to see the code.

Here is the Main method’s code, annotated for clarity:

; Copy method table pointer for the class into
; ecx as argument to new()
; You can use !dumpmt to examine this value.
mov ecx,006f3864h
; Call new
call 006e2100 
; Copy return value (address of object) into a register
mov edi,eax

Note that the actual addresses will be different each time you execute the program. Step over (F10, or toolbar) a few times until call 006e2100 (or your equivalent) is highlighted. Then Step Into that (F11). Now you will see the primary allocation mechanism in .NET. It’s extremely simple. Essentially, at the end of the current gen0 segment, there is a reserved bit of space which I will call the allocation buffer. If the allocation we’re attempting can fit in there, we can update a couple of values and return immediately without more complicated work.

If I were to outline this in pseudocode, it would look like this:

if (object fits in current allocation buffer)
{
   Increment a pointer, return address;
}
else
{
   call JIT_New to do more complicated work in CLR
}

The actual assembly looks like this:

; Set eax to value 0x0c, the size of the object to
; allocate, which comes from the method table
006e2100 8b4104          mov     eax,dword ptr [ecx+4] ds:002b:006f3868=0000000c
; Put allocation buffer information into edx
006e2103 648b15300e0000  mov     edx,dword ptr fs:[0E30h]
; edx+40 contains the address of the next available byte
; for allocation. Add that value to the desired size.
006e210a 034240          add     eax,dword ptr [edx+40h]
; Compare the intended allocation against the
; end of the allocation buffer.
006e210d 3b4244          cmp     eax,dword ptr [edx+44h]
; If we spill over the allocation buffer,
; jump to the slow path
006e2110 7709            ja      006e211b
; update the pointer to the next free
; byte (0x0c bytes past old value)
006e2112 894240          mov     dword ptr [edx+40h],eax
; Subtract the object size from the pointer to
; get to the start of the new obj
006e2115 2b4104          sub     eax,dword ptr [ecx+4]
; Put the method table pointer into the
; first 4 bytes of the object.
; eax now points to new object
006e2118 8908            mov     dword ptr [eax],ecx
; Return to caller
006e211a c3              ret
; Slow Path - call into CLR method
006e211b e914145f71      jmp     clr!JIT_New (71cd3534)

In the fast path, there are only 9 instructions, including the return. That’s incredibly efficient, especially compared to something like malloc. Yes, that complexity is traded for time at the end of object lifetime, but so far, this is looking pretty good!

What happens in the slow path? The short answer is a lot. The following could all happen:

  • A free slot somewhere in gen0 needs to be located
  • A gen0 GC is triggered
  • A full GC is triggered
  • A new memory segment needs to be allocated from the operating system and assigned to the GC heap
  • Objects with finalizers need extra bookkeeping
  • Possibly more…

Another thing to notice is the size of the object: 0x0c (12 decimal) bytes. As covered elsewhere, this is the minimum size for an object in a 32-bit process, even if there are no fields.

Now let’s do the same experiment with an object that has a single int field.

class MyObjectWithInt { int x; }

Follow the same steps as above to get into the allocation code.

The first line of the allocator on my run is:

00882100 8b4104          mov     eax,dword ptr [ecx+4] ds:002b:00893874=0000000c

The only interesting thing is that the size of the object (0x0c) is exactly the same as before. The new int field fit into the minimum size. You can see this by examining the object with the !DumpObject command (or the abbreviated version: !do). To get the address of the object after it has been allocated, step over instructions until you get to the ret instruction. The address of the object is now in the eax register, so open up the Registers view and see the value. On my computer, it has a value of 2372770. Now execute the command: !do 2372770

You should see similar output to this:

0:000> !do 2372770
Name:        ConsoleApplication1.MyObjectWithInt
MethodTable: 00893870
EEClass:     008913dc
Size:        12(0xc) bytes
File:        D:\Ben\My Documents\Visual Studio 2013\Projects\ConsoleApplication1\ConsoleApplication1\bin\Release\ConsoleApplication1.exe
Fields:
      MT    Field   Offset                 Type VT     Attr    Value Name
70f63b04  4000001        4         System.Int32  1 instance        0 x

This is curious. The field is at offset 4 (and an int has a length of 4), so that only accounts for 8 bytes (range 0-7). Offset 0 (i.e., the object’s address) contains the method table pointer, so where are the other 4 bytes? This is the sync block and they are actually at offset -4 bytes, before the object’s address. These are the 12 bytes.

Try it with a long.

class MyObjectWithLong { long x; }

The first line of the allocator is now:

00f22100 8b4104          mov     eax,dword ptr [ecx+4] ds:002b:00f33874=00000010

Showing a size of 0x10 (decimal 16 bytes), which we would expect now. 12 byte minimum object size, but 4 already in the overhead, so an extra 4 bytes for the 8 byte long. And an examination of the allocated object shows an object size of 16 bytes as well.

0:000> !do 2932770
Name:        ConsoleApplication1.MyObjectWithLong
MethodTable: 00f33870
EEClass:     00f313dc
Size:        16(0x10) bytes
File:        D:\Ben\My Documents\Visual Studio 2013\Projects\ConsoleApplication1\ConsoleApplication1\bin\Release\ConsoleApplication1.exe
Fields:
      MT    Field   Offset                 Type VT     Attr    Value Name
70f5b524  4000002        4         System.Int64  1 instance 0 x

If you put an object reference into the test class, you’ll see the same thing as you did with the int.

Finalizers

Now let’s make it more interesting. What happens if the object has a finalizer? You may have heard that objects with finalizers have more overhead during GC. This is true–they will survive longer, require more CPU cycles, and generally cause things to be less efficient. But do finalizers also affect object allocation?

Recall that our Main method above looked like this:

mov ecx,006f3864h
call 006e2100 
mov edi,eax

If the object has a finalizer, however, it looks like this:

mov     ecx,119386Ch
call    clr!JIT_New (71cd3534)
mov     esi,eax

We’ve lost our nifty allocation helper! We have to now jump directly to JIT_New. Allocating an object that has a finalizer is a LOT slower than a normal object. More internal CLR structures need to be modified to track this object’s lifetime. The cost isn’t just at the end of object lifetime.

How much slower is it? In my own testing, it appears to be about 8-10x worse than the fast path of allocating a normal object. If you allocate a lot of objects, this difference is considerable. For this, and other reasons, just don’t add a finalizer unless it really is required.

Calling the Constructor

If you are particularly eagle-eyed, you may have noticed that there was no call to a constructor to initialize the object once allocated. The allocator is changing some pointers, returning you an object, and there is no further function call on that object. This is because memory that belongs to a class field is always pre-initialized to 0 for you and these objects had no further initialization requirements. Let’s see what happens if we change to the following definition:

class MyObjectWithInt { int x = 13; }

Now the Main function looks like this:

mov     ecx,0A43834h
; Allocate memory
call    00a32100
; Copy object address to esi
mov     esi,eax
; Set object + 4 to value 0x0D (13 decimal)
mov     dword ptr [esi+4],0Dh

The field initialization was inlined into the caller!

Note that this code is exactly equivalent:

class MyObjectWithInt { int x; public MyObjectWithInt() { this.x = 13; } }

But what if we do this?

class MyObjectWithInt 
{ 
    int x; 

    [MethodImpl(MethodImplOptions.NoInlining)]  
    public MyObjectWithInt() 
    { 
        this.x = 13; 
    } 
}

This explicitly disables inlining for the object constructor. There are other ways of preventing inlining, but this is the most direct.

Now we can see the call to the constructor happening after the memory allocation:

mov     ecx,0F43834h
call    00f32100
mov     esi,eax
mov     ecx,esi
call    dword ptr ds:[0F43854h]

Exercise for the Reader

Can you get the allocator shown above to jump to the slow path? How big does the allocation request have to be to trigger this? (Hint: Try allocating arrays of various sizes.) Can you figure this out by examining the registers and other values from the running code?

Summary

You can see that in most cases, allocation of objects in .NET is extremely fast and efficient, requiring no calls into the CLR and no complicated algorithms in the simple case. Avoid finalizers unless absolutely needed. Not only are they less efficient during cleanup in a garbage collection, but they are slower to allocate as well.

Play around with the sample code in the debugger to get a feel for this yourself. If you wish to learn more about .NET memory handling, especially garbage collection, take a look at the book Writing High-Performance .NET Code.

Using Windbg to answer implementation questions for yourself (Can a Delegate Invocation be Inlined?)

The other day, a colleague of mine asked me: Can a generated delegate be inlined? Or something similar to this. My answer was that the generated code is going to be JITted and optimized like any other code, but later I started thinking…. “Wait a sec, can the actual call to the delegate be inlined?”

I’m going to give you the answer before I even start this article: no.

I cover the rules of method inlining that the JITter uses in my book, Writing High-Performance .NET Code, but I don’t discuss this specific situation. You could logically make the leap, however, that there are two other rules that imply this:

  • Virtual methods will not be inlined
  • Interface calls with multiple concrete implementations in a single call site will not be inlined.

While neither of those rules are delegate-specific, you can infer that a delegate call might have similar constraints. You could ask around on the Internet. Somebody on stackoverflow.com will surely answer you, but I want to show you how to find out the answer to this for yourself, which is an invaluable skill for harder questions, where you might not be able to find out the answer unless you know people on the CLR team (which I do, but I *still* try to find out answers before I bother them).

First, let’s see a test program that will exercise various types of function calls, starting with a simple method call that we would expect to be inlined.

using System;
using System.Runtime.CompilerServices;

namespace DelegateInlining
{
    class Program
    {
        static void Main(string[] args)
        {
            TestNormalFunction();
        }
        
        private static int Add(int x, int y) { return x + y; }

        [MethodImpl(MethodImplOptions.NoInlining)]
        private static void TestNormalFunction()
        {
            int z = Add(1, 2);
            Console.WriteLine(z);
        }
    }
}

The code we’re interested in inlining is the Add method. Don’t confuse that with the NoInlining option on TestNormalFunction, which is there to prevent the test method itself from being inlined The test method is there to allow breakpoint setting and debugging.

Build this code in Release mode for x86. Then open Windbg.

If you’re not used to using Windbg, I highly encourage you to start. It is far more powerful than Visual Studio’s debugger, especially when it comes to debugging the details of .NET. It is not strictly necessary for this particular exercise, but it is what I recommend.

To get, Windbg, install the Windows SDK—there is the option to install only the debugger if you wish.

In Windbg:

  1. Ctrl-E to open an executable program. Navigate to and open the Release build of the above program. It will start executing and immediately break
  2. Type the command: sxe ld clr. What we want to do is set a breakpoint inside the TestNormalFunction. To do that, we need to use the SOS debugger extension, which relies on clrjit.dll, which hasn’t been loaded in the process yet. So the first thing to do is set a breakpoint on loading clrjit.dll: sxe ld clrjit
  3. Enter the command g for “go” (or hit F5). The program will then break on the load of clrjit.dll.
  4. Enter the command .loadby sos clr – this will load the SOS debugging helper.
  5. Enter the command !bpmd DelegateInlining Program.TestNormalFunction – this will set a managed breakpoint on this method.
  6. Enter the command g to continue execution. Execution will break when it enters TestNormalFunction.
  7. Now you can see the disassembly for this method (menu View | Dissassembly).
00b80068 55              push    ebp
00b80069 8bec            mov     ebp,esp
00b8006b e8e8011b70      call    mscorlib_ni+0x340258 (70d30258)
00b80070 8bc8            mov     ecx,eax
00b80072 ba03000000      mov     edx,3
00b80077 8b01            mov     eax,dword ptr [ecx]
00b80079 8b4038          mov     eax,dword ptr [eax+38h]
00b8007c ff5014          call    dword ptr [eax+14h]
00b8007f 5d              pop     ebp
00b80080 c3              ret

There are some calls there, but none of them are to Add—they are all functions inside of mscorlib. The call to the dword ptr is virtual function call. These are all related to calling Console.WriteLine.

The key is the instruction at address 00b80072, which moves the value 3 directly into register edx. This is the inlined Add call. The compiler inlined not only the function call, but the trivial math as well (an easy optimization the compiler will do for constants).

So far so good. Now let’s look at the same type of thing through a delegate.

delegate int DoOp(int x, int y);

[MethodImpl(MethodImplOptions.NoInlining)]
private static void TestDelegate()
{
    DoOp op = Add;
    int z = op(1, 2);
    Console.WriteLine(z);
}

Change the Main method above to call TestDelegate instead. Follow the same steps given previously for Windbg, but this time set a breakpoint on TestDelegate.

00610077 42              inc     edx
00610078 00e8            add     al,ch
0061007a 8220d0          and     byte ptr [eax],0D0h
0061007d ff8bc88d5104    dec     dword ptr [ebx+4518DC8h]
00610083 e8481b5671      call    clr!JIT_WriteBarrierECX (71b71bd0)
00610088 c7410cc4053304  mov     dword ptr [ecx+0Ch],43305C4h
0061008f b870c04200      mov     eax,42C070h
00610094 894110          mov     dword ptr [ecx+10h],eax
00610097 6a02            push    2
00610099 ba01000000      mov     edx,1
0061009e 8b410c          mov     eax,dword ptr [ecx+0Ch]
006100a1 8b4904          mov     ecx,dword ptr [ecx+4]
006100a4 ffd0            call    eax
006100a6 8bf0            mov     esi,eax
006100a8 e8ab017270      call    mscorlib_ni+0x340258 (70d30258)
006100ad 8bc8            mov     ecx,eax
006100af 8bd6            mov     edx,esi
006100b1 8b01            mov     eax,dword ptr [ecx]
006100b3 8b4038          mov     eax,dword ptr [eax+38h]
006100b6 ff5014          call    dword ptr [eax+14h]
006100b9 5e              pop     esi
006100ba 5d              pop     ebp
006100bb c3              ret

Things got a bit more complicated. As you’ll read in Writing High-Performance .NET Code, assigning a method to a delegate actually results in a memory allocation. That’s fine as long that operation is cached and reused. What we’re really interested in here starts at address 00610097, where you can see the value 2 being pushed onto the stack. The next line moves the value 1 to the edx register. There are our two function arguments. Finally, at address 006100a4, we’ve got another function call, which is the call to Add, and the key to this whole thing becomes clear. The address of that function had to be retrieved via pointer, which means it’s essentially like a virtual method call for the purposes of inlining.

You can also do the same exercise with a lambda expression (it will look similar to the delegate disassembly above).

So there’s the simple answer.

There is one more interesting case: a delegate that calls into method A that calls method B. We already know that method A won’t be inlined, but can method B be inlined into method A?

[MethodImpl(MethodImplOptions.NoInlining)]
private static void TestDelegateWithFunctionCall()
{
    DoOp op = (x, y) => Add(x, y);
    int z = op(1, 2);
    Console.WriteLine(z);
} 

You can do the same analysis as above. You will see the call into the delegate/lambda will not be inlined, but there is no further function call, so yes, Method B can be inlined.

There you have it. Even though, the answer was pretty clear from the start, you at least have the tools to answer it or yourself. Don’t be afraid of the debugger, or of looking at assembly code, even for .NET programs.

Announcing Writing High-Performance .NET Code

This blog has been silent for far too long. That’s because I’ve been heads-down on a side project for the last 10 months. I’d like to announce my latest technical book:

Writing High-Performance .NET Code

Cover-Tall-2000x2828

If you write managed code, you want this book. If you have friends who write managed code, they want this, even if they don’t know it yet.

Do you want your .NET code to have the absolute best performance it can? This book demystifies the CLR, teaching you how and why to write code with optimum performance. Learn critical lessons from a person who helped design and build one of the largest high-performance .NET systems in the world.

This book does not just teach you how the CLR works—it teaches you exactly what you need to do now to obtain the best performance today. It will expertly guide you through the nuts and bolts of extreme performance optimization in .NET, complete with in-depth examinations of CLR functionality, free tool recommendations and tutorials, useful anecdotes, and step-by-step guides to measure and improve performance.

Among the topics you will learn are how to:

  • Choose what to measure and why
  • Use many amazing tools, freely available, to solve problems quickly
  • Understand the .NET garbage collector and its effect on your application
  • Use effective coding patterns that lead to optimal garbage collection performance
  • Diagnose common GC-related issues
  • Reduce costs of JITting
  • Use multiple threads sanely and effectively, avoiding synchronization problems
  • Know which .NET features and APIs to use and which to avoid
  • Use code generation to avoid performance problems
  • Measure everything and expose hidden performance issues
  • Instrument your program with performance counters and ETW events
  • Use the latest and greatest .NET features
  • Ensure your code can run on mobile devices without problems
  • Build a performance-minded team

…and much more.

See http://www.writinghighperf.net for up-to-date information about the book. You can also like the Facebook page or subscribe to this blog to see updates.

The book is currently available via Amazon and Kobo. Barnes and Noble is pending. More retailers and formats will follow. See the Buy page to check for current availability.

I will also be posting some blog entries with topics inspired by the book, but weren’t quite a good fit.

How To Debug GC Issues Using PerfView

Update: If you find this article useful, you can find a lot more information about garbage collection, debugging, PerfView, and .NET performance in my book Writing High-Performance .NET Code.
In my previous artlcle, I discussed 4 ways to optimize your server application for good garbage collection performance. An essential part of that process is being able to analyze your GC performance to know where to focus your efforts. One of the first tools I always turn to is a little utility that has been publically released by Microsoft.

PerfView Overview

PerfView is a stand-alone, no-install utility that can help you debug CPU and memory problems. It’s so light-weight and non-intrusive that it can be used to diagnose production applications with minimal impact.

I’ve never used it for CPU performance, so I can’t comment on that aspect of it, but that is the primary use for it (which is helpful to keep in mind when trying to grok the “quirky” UI).

PerfView collects data in two ways (as far as memory analysis is concerned):

  1. ETW tracing – This is the heart and soul of PerfView. It’s primarily an event analyzer with advanced grouping abilities to show you only the important things. If you want to know more about ETW, see this series at the ntdebugging blog.
  2. Heap dump – PerfView can dump the heap of your process and apply the same analysis and views that it does for events.

The basic view of the utility is a spreadsheet-like UI with function names and associated inclusive/exclusive costs – just like you would expect to see in a typical CPU profiler. The same paradigm is useful for memory analysis as well.

There are other views that summarize the collected events for you in easy-to-understand reports. We’ll take a quick look at all of this.

In this article, I’ll use PerfView to show you how to see the following:

  • How frequently garbage collections occur and how long they take.
  • The cause for Gen2 collections.
  • The source of large-object allocations.
  • The roots of all the memory in the heap to see who’s holding on to it.
  • A diff of the heap to see what’s changing most frequently.

Test Program

When using a new utility like this, it’s often extremely helpful to create your own test programs with known behavior to ensure that you can use the utility to see what you expect. I’ve created a very simple one, here:

class Program
{
    private static List<int[]> arrays = new List<int[]>();
    private static Random rand = new Random();

    static void Main(string[] args)
    {            
        Console.WriteLine("Press any key to exit...");
        while (!Console.KeyAvailable)
        {
            int size = rand.Next(1024, 100000);
            int[] newArray = new int[size];
            arrays.Add(newArray);
            System.Threading.Thread.Sleep(10);
        }
        Console.WriteLine("Done, exiting");
    }
}

This program “leaks” memory by continually creating arrays and storing them in a list that never gets cleared.

I also make it use server GC, to match what I discussed in the first article.

You can download the sample solution here.

Taking a Trace

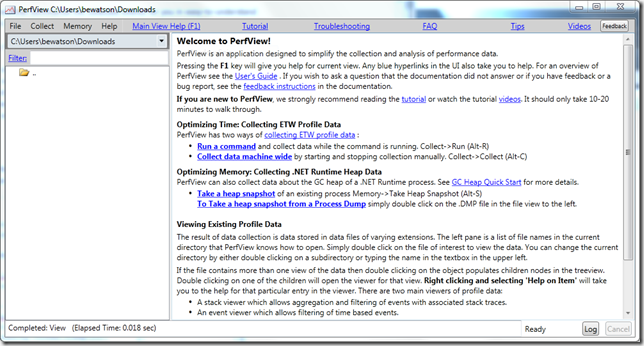
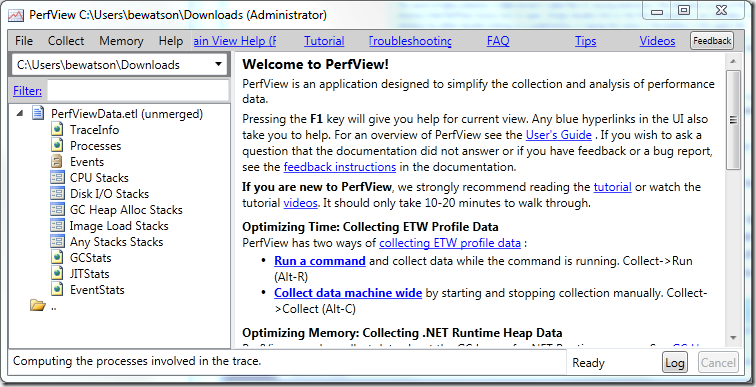
When you startup PerfView, you’ll see a window like this:

image

The manual is completely integrated into the program and can be accessed using the links in the menu bar. It’s a fairly dense information dump, but you can learn quite a bit about how to really get the most of out this utility.

First, start the test program and let it run in the background until we’re done taking the trace.

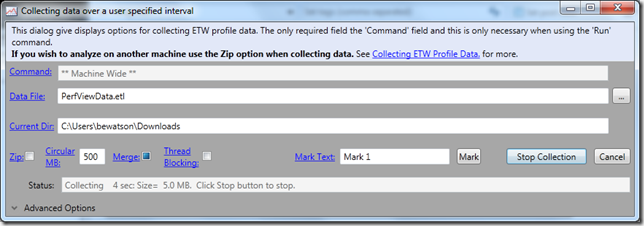
In PerfView, open the Collect menu and select the Collect command. A collection dialog will appear. Don’t change any setting for the moment and just hit Start Collection.You’ll see some status indicating the size and duration of the data collected. Let it go for at least 30 seconds. Note that you don’t specify which process you’re interested in at this stage – PerfView collects events for the machine as a whole.

image

When you’re done click Stop Collection. PerfView will process the collected events for a few seconds or minutes, and then a window will pop up asking you to select a process. Just cancel this (it wants to show you a CPU profile, which we’re not interested in right now) to get back to main screen.

You’ll now see a file show up: PerfViewData.etl (unmerged). Click on the little arrow next to this and you’ll see:

image

From this, we’ll find all the data we’re interested in.

Get GC Stats (pause times and more)

The first place to start is just to get an overall picture of GC performance for your app. There is a view for just that. Double-click the GCStats report, and that will bring up a window with tables for each app. Find MemoryLeak.exe

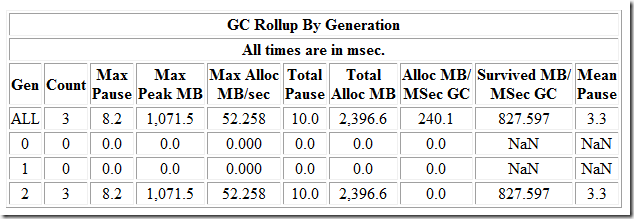
My test run yields this summary table:

image

Every garbage collection was a generation 2 collection (that’s generally a bad thing), but at least they were fast (to be expected in such a simple program).

Reason for Gen 2 Collection

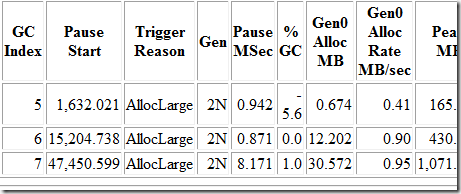
Gen 2 GCs can happen for two reasons—surviving a gen 1 collection, or allocating on the large object heap. This view will also tell us, further down, which of these is the reason:

image

The collections happened because of large object allocation. You can also see that the second GC happened about 14 seconds after the first, and the next about 32 seconds after that. There are tons of other stats in this view, so look around and see what you can divine about the program’s behavior from this.

Get Source of Large Allocations

From the main PerfView screen, open the GC Heap Alloc Stacks view and find the correct process. This shows you a list of objects which represent the tops of allocation stacks.

image

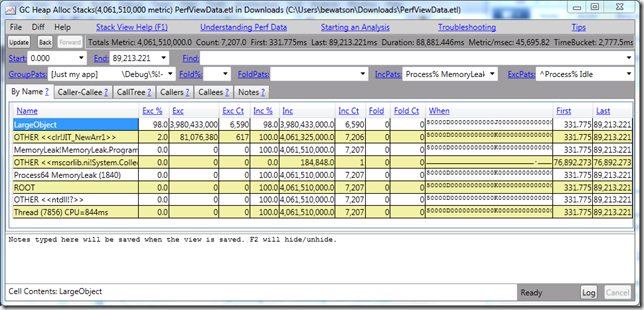
PerfView has helpfully organized all large-object allocations under the LargeObject entry. Double click this to see all such all allocations:

image

Important: If you see entries like this:

OTHER <<clr?>>

Then right-click on the list and click on Lookup Symbols. Follow the instructions to get the symbol server setup so you can see CLR and Windows function names.

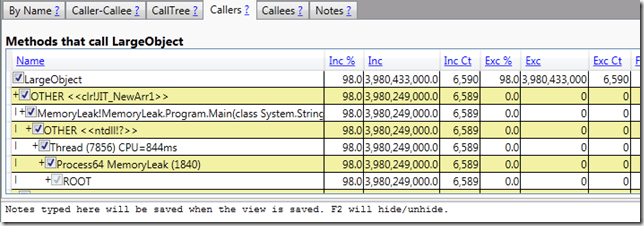
From the above entry view, it’s apparent that the vast majority of large objects are arrays being allocated in Main()—exactly what we expect given our predictable leaky program.

A note on the strange column names: remember how I said this program is designed for CPU profiling? These are typical columns for showing% of CPU time in various parts of a stack, repurposed for memory analysis. Inc % is the percent of bytes allocated on this object compared to all recorded allocations, Inc is the number of bytes allocated, and Inc Ct is the number of objects allocated.

In the above example, this reads: Allocated 6589 arrays for a total of 3.9 GB, accounting for 98% of the memory allocated in the process.

By the way, these are not 100% accurate numbers. There is some sampling going on because of how the events work, but it should be fairly close in most applications.

Who’s Referencing Leaking Memory?

One of the few ways to “leak” memory in C# is to hold onto it unknowingly. By taking a heap dump, we can see the path of object references for who’s holding onto memory.

We’ll need to do a different type of collection. In the main PerfView window. Go to the Memory menu and click Take Heap Snapshot.

image

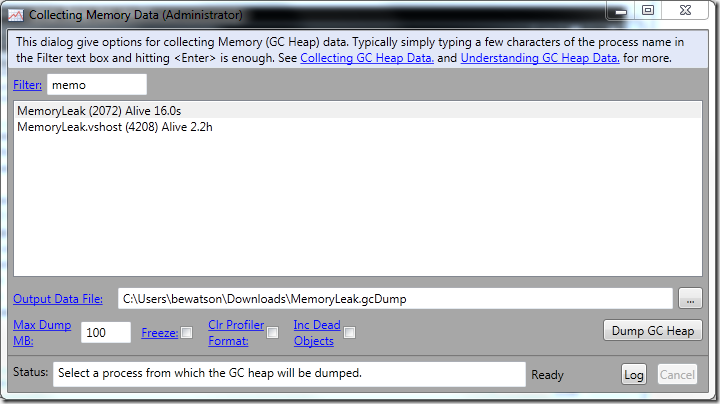
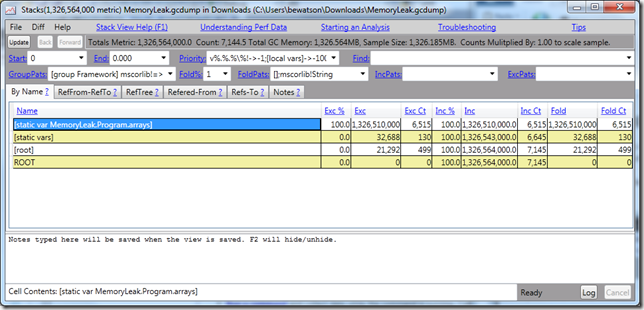
Find your process and click Dump GC Heap. This performs a live heap walk (that is, the application continues running, so it’s possible the view is slightly inconsistent—not usually an issue), sampling what it finds, and presenting the results in the same type of view as before:

image

Right away you can see that the static variable MemoryLeak.Program.arrays is holding onto 100% of memory in our application. The stack to the root isn’t that interesting in this case because all static variables are rooted directly, but if this were a member field, you would see the hierarchy of objects that are holding onto these references.

Use Two Heap Dumps to see What’s Increasing Fastest

While the test program is still running, take another heap dump, ensuring you save it to a different file. Open both dump views and in the second one, go to the Diff menu and there will be an option to use the other file as a baseline for the diff. This will bring up another window showing you the changes between the two dump files—extremely helpful for narrowing down the most likely areas for leaks.

Important: If you want to analyze the perf trace on a different computer than the one you took it on, you must tell PerfView to merge the file—this will cause all the different files it generated to be combined and symbols reconciled. Just right-click on the ETL file and select Merge. You can also optionally Zip the file (which implies a Merge).

Next Time

Next time, we’ll look at some more drastic measures for protecting yourself against expensive GCs—for when all else fails.

Resources

  • Download the sample test program here.
  • Get PerfView here.

4 Essential Tips for High-Performance Garbage Collection on Servers

Garbage CollectionUpdate: If you find this useful, you can read a much more complete treatment of garbage collection and performance in my book Writing High-Performance .NET Code.
Update: Part 2 – How to Debug GC Issues with PerfView is now available.

On this blog, I’ve alluded to the fact that I work on high-performance server applications, most recently in .Net. Writing these in .Net is just as possible as it is in native code, but it does come with its own set of challenges. In particular, one of the biggest things you need to learn how to deal with is garbage collection.

There is a lot out there already written about the CLR’s garbage collector, so I’m not going to go over many of the details. If you need a primer on it, MSDN has some documentation:

Read that first. For the rest of this article series, I will assume that you understand how the GC basically works.

In this and future articles, I’ll cover a lot of the stuff I’ve learned to improve application performance in the face of garbage collection.

Tip 1: Use Server GC

There are two modes of garbage collection (GC): workstation and server. As long as you’re running multiple processors, you almost certainly want server mode collection. With workstation mode, a GC happens on the thread that makes the allocation that causes the GC. The collection happens at normal priority.

With server GC, a thread for every core is created just for doing GC. There is also a small object heap and a large object heap created for each GC thread. All of the program’s allocations are spread among these heaps (more on large object heaps later). When no GC is happening, these threads are blocked and do nothing. When a GC is triggered, all of the user threads get paused, and all the GC threads wake up at highest priority and do collection in parallel. All of these optimizations lead to server GC usually being much faster than workstation GC.

A word about concurrent collections: In workstation GC, concurrent collections are enabled by default. However, this only applies to generation 2 collections. Generations 0 and 1 are always blocking. However, given that it’s concurrent, that means that it will compete with your own threads that are trying to get actual work done. In a high-performance server scenario, that may not be acceptable. A better strategy is to ensure that generation 2 collections never (or extremely rarely) happen.

You enable server GC by putting this in app.config:

<configuration>
   <runtime>
      <gcServer enabled="true"/>
   </runtime>
</configuration>


Tip 2: Objects Live Briefly or Forever

A histogram of object lifetimes in your app should look essentially like this:

image

Object last either a vanishingly brief amount of time, or they last forever – it’s the stuff in the middle that will kill your performance.

This has everything to do with the generations of garbage collection and object survivorship. There are three generations: 0, 1, and 2. Generation 0 happens most often and is the fastest—ideally lasting only a couple of milliseconds, if that. Objects that didn’t get cleaned up in generation 0 are put into generation 1. Generation 1 collections are also very fast, usually as fast as generation 0. The problem, though, is that objects that make it to generation 1 have a fair chance of surviving this generation, and being put into generation 2.

Generation 2 is the problem. A generation 2 collection is much slower than 0 or 1—often on the order of hundreds of milliseconds or even seconds—that means your process is paused completely for that time. You do not want objects to survive to generation 2.

So how often do collections happen? There is no hard-and-fast rule: it all depends on your allocation rate, memory pressure, and patterns that you’ve trained into the GC. The GC will adapt over time, training itself on your memory usage patterns. All of this completely depends on your application and I’ll look at ways to measure all of this in a future article.

Tip 3: All Long-Lived Objects Must Be Pooled

It may be that you can’t ensure all objects for a given request are cleaned up in the first generation 0 collection that occurs. If requests are in memory longer than the time between collections, then you’re guaranteed to have survivorship.

For these types of objects, first see if you can factor them so that not all parts them have to live that long. Control object lifetime very closely and null out references once you’re done.

Once you’ve done that, hopefully there are only a handful of objects that really must last the entire length of a request. For those, create a pool of them with reinitialization semantics—effectively move them to the far end of that histogram above, where they live forever.

This works because of the adaptive nature of the garbage collector – it learns over time that if it does a collection and doesn’t free up much memory, it will schedule that generation of collection to happen less frequently. In my own case, at one point, our server had trained the GC to do a generation 2 collection less often than once per day, under a constant load. With enough work, we could probably get that to essentially never.

You may be able to get quite far without the need to implement object pooling. Or you may need to pool only a small number of objects, and the survivorship of the remaining objects is not enough to cause problematic garbage collections—only measurement and observation will tell you for sure.

Tip 4: All Large Objects Must Be Pooled

There is a way to cause an object to automatically be in generation 2: make it at least 85000 bytes in size. Anything at least that size gets put into a Large Object Heap. Only generation 2 collections service that type of heap.

Want to cause a generation 2 collection? Do this:

byte[] buffer = new byte[85000];

If you want high-performance, you absolutely cannot do this per request on a server. These types of buffers, or other large objects, must be pooled. There is no built-in pooling mechanism in .Net—you must write your own. There are usually not too many large objects you’ll need to pool: strings and byte buffers are the usual suspects, if you need to do much serialization/deserialization, but also look out for collections of any type.

If you want to know more about the Large Object Heap and why 85000 bytes is the threshold, read this great article: Large Object Heap Uncovered.

Pooling collection objects comes with its own set of challenges:

  • You can’t assume the full collection is valid (the difference between length and capacity). If you use pooled arrays, for example, you have to track the length separately, since only a small portion of the array may be valid. This can drastically affect the interfaces between components.
  • Pooled collections that can grow over time will cause your memory to rise indefinitely unless you put limits on the size of the pool and/or the size of collections within the pool.
  • Large Object Heaps are not compacted during collection, which means that you can fragment the heap such that it’s wasting a lot of memory. It all depends on your allocation and collection pattern. I may talk about heap fragmentation in another article.

Once you solve those, you’re good to go… no more generation 2 collections!

Next Time…

In my next article, I’ll cover tools you can use to measure garbage collection statistics, and how you can use that knowledge to improve your performance.

Alternative to Double-Checked Locking: Lazy<T>

A common pattern for lazy-initialization of a possibly-expensive type is double-checked locking.

The pattern is essentially this:

// member field
private volatile MyType myObject = null;
private object myLock = new object();

public MyType MyObject
{
    get
    {
        if (myObject == null)
        {
            lock(myLock)
            {
                if (myObject == null)
                {
                    myObject = new MyType();
                }
            }
        }
    }   
}

It’s quite common, and it’s also common to get it subtly wrong (not using volatile, for example).

However, in .Net 4, there’s a simpler way to do this: use Lazy<T>. This type uses a delegate to initialize the value with double-checked locking (there are other possible thread safety modes as well).

private Lazy<MyType> myObject = new Lazy<MyType>( () => new MyType );

public MyType MyObject
{
    get
    {
        return myObject.Value;
    }   
}

With Lazy<T>, the delegate you pass in will not be called until the Value property is accessed. Depending on the options you set, only a single thread will call your delegate and create the real type. I’d much rather do this than have to look at double-checked locking patterns scattered throughout a code base.

Like this tip? Check out my book, C # 4.0 How-To, where you’ll finds hundreds of great tips like this one.

Use Appropriate Collections

.Net makes using fancy collections very easy. In fact, it can be almost too easy. It is so simple to just throw in a List<T> or a ConcurrentDictionary<K, T> that it’s tempting to do it at every opportunity.

Today’s tip is to stop and think critically about the type of collections you need.

Some examples:

  • I was doing a code review recently and saw that this person was using Dictionary<string, bool> where every value was true. This is not a dictionary—it’s a set with complicated accessors. So use HashSet<T> – it has a simpler API, which will lead to your own code being simpler and more correct semantically. Dictionary<K, T> has a meaning, and if you’re abusing that meaning, then your code is likely incorrect, or in the best case, misleading (and thus a maintenance problem, and thus incorrect!).
  • Performance characteristics are often non-intuitive. For example, if you’re doing a lot of searching for values, which would you use? Dictionary<K, T> or List<T>? Most people would say the Dictionary, and perhaps in 95% of cases, they’re right. On the other hand, if you only have a few values, you may get better performance because of cache locality with a binary search over a List (or even a linear search), which is usually implemented as an array.
  • Speaking of arrays, if you have a read-only vector of a known size, use arrays instead of Lists. It’s semantically more correct, simpler, and usually more performant.
  • Another code review I was doing had usage of ConcurrentDictionary<K, T>. This sounds like a great type to use when you need to modify and/or read a dictionary with multiple threads, but the usage of this type is not that straightforward, and in fact the official documentation is unclear on some things. In this case, it was better to redesign at a higher level to avoid use of this type.
  • I’ve seen this type of code in reviews a few times:
var list = new List<MyObject>();
for (int i =0;i < source.Count; ++i)
{
    list.Add(source.Get(i));
}

        In most apps maybe this doesn’t matter. If you care about performance, then you should care that there are going to be an unknown number of pointless memory allocations, plus multiple copies of the old data into the new arrays. In a high-performance system, this matters. Use the constructor of the collection that takes an initial size. (Guess how many items are in the default List<T> internal item array: None.)

Some questions you can ask yourself:

  • Is the collection semantically correct? Or am I abusing it because it can do what I want? Do I have restrictions on the use of the collection that are not obeyed by the API of the collection? Is there a more appropriate data structure I can use? If not, should I wrap this collection into an API with suitable restrictions?
  • Am I using the simplest collection possible?
  • Is this collection type performant for how it will be used? How can I measure to make sure? Am I making assumptions that may be unfounded because of usage patterns or hardware optimizations? Am I initializing the data structure correctly, to avoid unnecessary memory reallocations?
  • Is the collection type I’m considering too complex to use effectively? Would it be better to redesign something at a higher level to avoid needing to use this collection type?

Collections are usually the core of any application (if you don’t have data, what you are acting upon?). Getting these right means simpler code, better performance, higher readability, and long-term maintainability. It doesn’t take any more work (usually) – it just takes a few moments to think about what you’re really doing.

Like this tip? Check out my book, C # 4.0 How-To, where you’ll finds hundreds of great tips like this one.

Don’t Log Exception Stacks Unless You Can Afford It

A short, simple tip for this week: Don’t log exception stacks in managed applications unless you understand the performance of your system.

If you have a standard desktop client, or some other app where you can tolerate many-millisecond disruptions or a spike in CPU usage, then you don’t have to care about this.

If you are building a high-performance managed system, then you definitely do have to care about this.

The system I work on needs to handle exceptions coming from 3rd-party components. We can’t let the exceptions kills the process, and we can’t swallow them, ignoring the component failure, so we need to log them. The question is—what information do we log?

For managed exceptions, there are three properties that are most generally useful: type of the exception, Message, and StackTrace.

Getting the type and the Message are nearly free, but accessing StackTrace or calling ToString() on the exception object will cause a bunch of reflection to happen to build up a user-friendly stack trace string. If you can do without, go for it. It may be possible to augment the Message property of an exception to give some clues to the problem. Usually, however, this will not be possible.

Since getting the stack trace for an exception is relatively expensive, especially for a program that shouldn’t miss a beat and needs to continue running, many of the managed applications that I work on have a configuration setting to be able to turn off stack trace logging for exceptions. This enables us to either run it turned on until we see a performance problem, or keep it off until there is a reproable problem, when we can turn it on selectively.

Like this tip? Check out my book, C # 4.0 How-To, where you’ll finds hundreds of great tips like this one.